| Statistic | Blackwater | Arizona | National |
| Population | 1,740 | 7,278,717 | 328,239,523 |
| Population density (sq mi) | 97 | 65 | 91 |
| Median age | 29.4 | 37.1 | 37.7 |
| Male/Female ratio | 0.8:1 | 1.0:1 | 1.0:1 |
| Married (15yrs & older) | 39% | 53% | 55% |
| Families w/ Kids under 18 | 34% | 42% | 43% |
| Speak English | 82% | 73% | 79% |
| Speak Spanish | 4% | 20% | 13% |
The population of Blackwater is 1,740, with a population density of 97 people per square mile, diverging from the national average of 91. The median age is 29.4 and 39% of individuals aged 15 or older are married, while 34% have children under 18. As far as income equality in Blackwater goes, 54% of households have a median income below $25,000, whereas 6% report an income exceeding $150,000. The Blackwater demographics data can provide indispensable insights into the composition, dynamics and needs of cities, towns or even villages, empowering planners, developers and policymakers to devise strategies that foster prosperity, equity and well-being for all residents.
The Blackwater racial demographics and ethnicity breakdown serves as a critical tool for understanding and addressing systemic inequities, promoting social justice and inclusion and building stronger, more resilient communities. The racial breakdown in Blackwater is 1.7% White, 1.1% Black or African American, 0% Asian, 92.6% American Indian and 0.6% Native Hawaiian - 3.9% of the population identify as Hispanic or Latino. Of all households, 81.5% reported speaking English only, while 3.7% reported speaking Spanish only. A total of 0.6% of residents were considered foreign born.
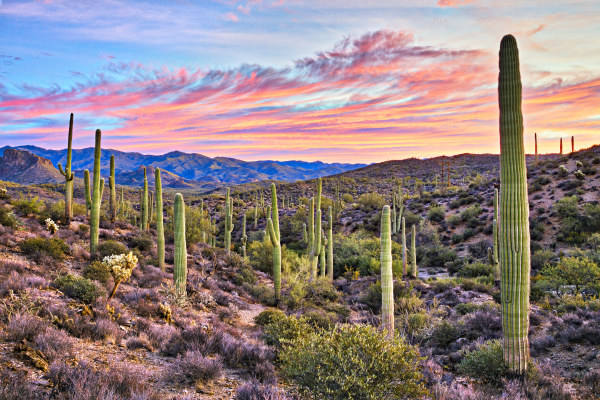
Towns, villages or even small cities with below-average population density, like Blackwater, offer the expectation of a more laid-back lifestyle, deeper immersion in nature, strong community bonds, improved affordability and enhanced safety, drawing individuals seeking respite from the hustle and bustle of urban living. These regions often feature a more affordable cost of living, with housing prices typically more reasonable and residents may enjoy reduced taxes, living expenses and insurance rates. Low population density areas generally boast lower crime rates than densely populated urban areas, fostering a greater sense of safety and security for residents and their families. Blackwater has a population density of 97 people per square mile, which falls below 50% of cities nationwide, positioning it to leverage these outstanding benefits.
Understanding Populations: Reporting and analyzing the demographic data in Blackwater can allow us to gain insights into the characteristics and composition of populations, including age, gender, race, ethnicity, income, education and other socio-economic factors. This understanding is essential for addressing the diverse needs, preferences and challenges of different demographic groups within communities. Demographics can play a crucial role in understanding populations, informing decision-making processes and promoting equity, inclusion, and well-being for all individuals and communities. Blackwater population data serves as a foundation for addressing social, economic, and environmental challenges and promoting the well-being and resilience of societies.
Education Allocation: In education planning, Blackwater demographic data can be invaluable for identifying student demographics, school enrollment trends and educational needs. This data aids schools and policymakers in resource allocation and the formulation of effective educational programs. It serves as a crucial tool for recognizing disparities in educational access and outcomes among different demographic groups, including racial and ethnic minorities, socio-economic status and students with disabilities. Through the disaggregation of data by demographic factors, education planners can pinpoint areas of inequity and implement targeted interventions to enhance access, support, and outcomes for marginalized students. Overall, Blackwater demographic data can be an essential tool in education for promoting equity, facilitating student success, and nurturing inclusive learning environments that cater to the needs of all students.
Social Cohesion: The examination and interpretation of demographics are pivotal for nurturing social cohesion and promoting understanding among diverse communities. By acknowledging and honoring differences in Blackwater demographics, societies can champion inclusivity, diversity and social cohesion while addressing social disparities and advocating for equitable opportunities. Racial demographics can potentially showcase the diversity of a population and are crucial for fostering inclusive and embracing communities. Embracing diversity fortifies social bonds, fosters cultural appreciation and enriches society by celebrating the contributions of individuals from diverse racial and ethnic backgrounds.
| Race | Blackwater | Arizona | National |
| White | 1.67% | 77.80% | 73.35% |
| Black | 1.15% | 4.27% | 12.63% |
| Asian | 0.00% | 3.05% | 5.22% |
| American Indian | 92.64% | 4.41% | 0.82% |
| Native Hawaiian | 0.57% | 0.19% | 0.18% |
| Mixed race | 3.97% | 3.31% | 3.06% |
| Other race | 0.00% | 6.97% | 4.75% |
 Here are the best places to live in Arizona
 Most Dangerous States In The US
 Safest States In The US
 Check out the 10 safest cities in Arizona