| Index | Thompsonville | Texas | National |
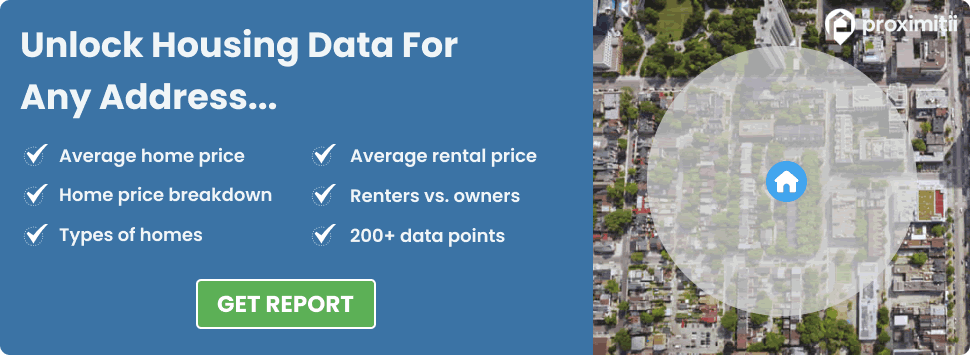
| Median home price | $0 | $142,700 | $184,700 |
| Median rent asked | $0 | $911 | $949 |
| Avg. people per household | 1.8 | 2.8 | 2.6 |
| Owner occupied households | 100.0% | 61.9% | 63.6% |
| Renter occupied households | 0.0% | 38.1% | 36.4% |
| Population | Home Price | National Avg. | |
| South Fork Estates, TX | 60 | $0 | 100% |
| Thompsonville, TX | 190 | $0 | 100% |
| Population | Home Price | National Avg. | |
| Howard City, NE | 190 | $38,800 | 79% |
| Salt Point, NY | 190 | $0 | 100% |
| Bonita, LA | 190 | $0 | 100% |
| Murphy, ID | 190 | $0 | 100% |
| Harris, IA | 190 | $59,500 | 68% |
| Thompsonville, TX | 190 | $0 | 100% |
 Here are the best places to live in Texas
 Check out the 10 most dangerous cities in Texas
 See the best places to live in Thompsonville
 These are the 10 cheapest cities in Texas