| Statistic | Reportedincidents | /100k people | Fairmount Heights/100k people | Maryland/100k people | National/100k people |
| Total crime | 0 | n/a (estimate) | 1,020 (estimate) | 2,497 | 2,281 |
| Murder | n/a | n/a | n/a | 8.3 | 5.7 |
| Rape | n/a | n/a | n/a | 31.9 | 38.0 |
| Robbery | n/a | n/a | n/a | 130.7 | 66.5 |
| Assault | n/a | n/a | n/a | 255.2 | 264.1 |
| Violent crime | n/a | n/a (estimate) | 174 (estimate) | 426 | 364 |
| Burglary | n/a | n/a | n/a | 185.9 | 250.7 |
| Theft | n/a | n/a | n/a | 1,337.8 | 1,347.2 |
| Vehicle theft | n/a | n/a | n/a | 547.4 | 318.7 |
| Property crime | n/a | n/a (estimate) | 846 (estimate) | 2,071 | 1,917 |

| Item | Fairmount Heights | Maryland | National |
| Law enforcement employees (officers & civilians) | 1 | 5,343 | 558,732 |
| Police officers & civilians /1000 residents | 0.7 | 3.3 | 3.3 |
| State | Total offenders | Maryland /100K | National /100K |
| Maryland | 7,370 | 135 | 266 |
| City | Population | Violent crime/100k people | Property crime/100k people | Total crime/100k people |
| Chevy Chase View, MD | 1,151 | 60 | 291 | 350 |
| Martin's Additions, MD | 1,089 | 60 | 291 | 350 |
| Derwood, MD | 1,644 | 60 | 291 | 350 |
| Chevy Chase, MD | 2,979 | 67 | 325 | 392 |
| Cabin John, MD | 2,276 | 67 | 325 | 392 |
| Kensington, MD | 2,212 | 67 | 325 | 392 |
| Chevy Chase town, MD | 2,948 | 67 | 325 | 392 |
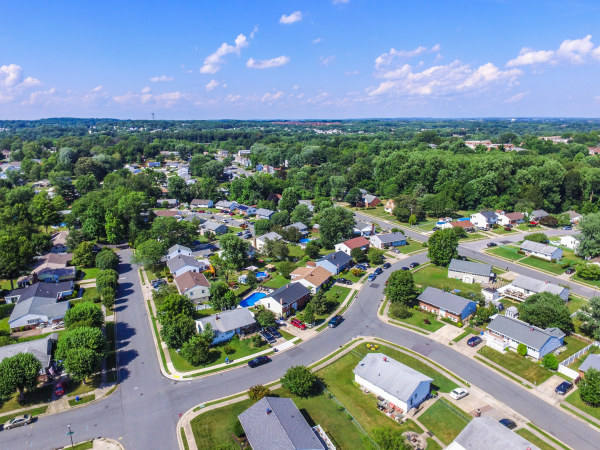
| Fairmount Heights, MD | 1,381 | 174 | 846 | 1,020 |
| City | Population | Violent crime/100k people | Property crime/100k people | Total crime/100k people |
| Springfield, CO | 1,381 | 250 | 1,517 | 1,766 |
| Kingsford Heights, IN | 1,381 | 161 | 749 | 911 |
| Ligonier, PA | 1,381 | 52 | 308 | 359 |
| Benwood, WV | 1,381 | 118 | 530 | 648 |
| Gilcrest, CO | 1,381 | 214 | 1,298 | 1,512 |
| Fairmount Heights, MD | 1,381 | 174 | 846 | 1,020 |
 Here are the best places to live in Maryland
 Most Dangerous States In The US
 These are the 10 cheapest cities in Maryland
 Check out the 10 most dangerous cities in Maryland